Reputation+
If you're responsible for your brand's social media presence, you've likely felt the pressure to prove your work is paying off. Social media reporting is how you do that. It's one of the most important tasks in the social media management process, helping you demonstrate the value of your efforts, identify opportunities for growth, and make smarter decisions about your brand's social strategy.
| Do you want to jump to the free Social Media Report Template? Click here. |
Key Takeaways
- Demonstrate ROI: Social media reports are essential for proving the value of marketing efforts and securing budget.
- Tailor your data: Customize reports based on the audience; executives need high-level ROI, while marketing teams need granular campaign performance.
- Focus on quality metrics: Beyond likes and reach, track sentiment and "types of comments" (e.g., purchase intent) to understand true brand impact.
- Visualize for clarity: Use charts and comparative analysis to transform raw data into a narrative that highlights growth trends.
- Leverage AI insights: Automated sentiment analysis helps identify customer pain points and brand favorability that manual tracking might miss.
What is a social media report?
A social media report is a document that compiles and analyzes data from your social media activities over a specific timeframe. Reports can cover data weekly, monthly, or quarterly. The goal is to transform raw metrics into actionable insights that help your brand understand not only the numbers but also their significance.
Effective social media reports typically include:
- Performance metrics: Engagement rates, reach, impressions, conversions, and other KPIs tied to your goals.
- Audience insights: Follower growth, demographics, and behavior patterns that reveal who your audience is.
- Strategic recommendations: Data-driven next steps to improve results and optimize future campaigns.
Why social media reporting matters
Managing social media is complex, and proving its impact can be just as challenging. For many organizations, social media is still seen as a 'nice-to-have' rather than a key driver of business growth. Without clear data, it's difficult to secure buy-in from leadership, justify budgets, or demonstrate why your work matters.
Social media reporting changes that. It goes beyond calculations by helping you understand what's working, what needs improvement, and how your social media marketing efforts contribute to business goals. A well-structured report can highlight successes, show trends over time, and make the case for the resources you need to scale.
Here are some of the key reasons social media reporting is essential:
- Performance Evaluation. Social media reporting is crucial for assessing the effectiveness of marketing campaigns by tracking metrics like engagement, reach, and conversions.
- Data-Driven Decision Making. It empowers data-driven decisions by offering actionable insights to refine content, schedules, and budgets based on performance data.
- Audience Understanding. Reporting provides insights into audience demographics, preferences, and behaviors, enabling tailored content and strategies.
- Competitive Analysis. It helps benchmark social media performance against competitors, identifying trends and areas for improvement.
- ROI Measurement. Reporting determines which campaigns deliver the best results and where to allocate resources.
- Content Optimization. It guides content strategy by highlighting high-performing content and areas needing improvement.
- Crisis Management. Reporting monitors sentiment to detect potential PR crises, enabling prompt responses.
- Resource Allocation. It identifies high-value social media channels and campaigns, preventing waste of time and resources.
- Compliance and Accountability. Reporting maintains records for compliance and accountability, which is crucial for adhering to regulations and standards.
- Goal Tracking. Reporting tracks progress toward objectives, allowing for strategy adjustments.
- Improves Engagement. It provides insights into the best times to engage with the audience, enhancing user experience.
- Enhances Customer Service. Reporting monitors customer feedback and inquiries, enabling prompt responses and building brand loyalty.
- Adaptation to Trends. It keeps businesses informed about emerging trends and platforms, streamlining adaptation and opportunity capture.
- Long-Term Marketing Strategy Development. It informs the development of long-term strategies, setting realistic goals for sustained success.
How to craft an effective social media report
You've built your social media strategy, run campaigns, and managed engagement across channels. Now, it's time to review, analyze, and communicate what that activity actually delivered. This report should go beyond a KPI summary. It should clarify what drove results, where you fell short, and what to do differently next cycle.
1. Identify your target audience
Determine the intended recipients of your report. Tailor your content to match the interests and needs of your boss, marketing team, or other stakeholders. Customize your approach and type of content to resonate with each specific group.
2. Define clear objectives
Begin your reporting journey by setting clear objectives. Are you aiming to increase brand awareness, drive website traffic, or boost engagement? Your report's structure and metrics should align with these goals.
For instance, if your aim is to boost engagement, consider the significance of pinpointing shared characteristics among top-performing posts.
3. Select key metrics
A well-rounded social media report covers different metrics like engagement, reach, click-through rates, and conversion data. However, don't overwhelm your report with excessive metrics; focus on those that directly contribute to your objectives.
It helps to organize your metrics into three categories based on what you're trying to achieve:
-
Engagement metrics: Likes per post, comments per post, engagement rate, shares, and mentions. These reveal how well your audience connects with your content and are especially valuable for brand-building campaigns.
-
Performance metrics: Reach, impressions, followers and follower growth. These measure how far your content spreads and are key for campaigns focused on increasing brand awareness and visibility.
-
Conversion metrics: Click-through rates, conversions, and ROI. These reveal how effectively your campaigns drive tangible results and are essential for lead generation and sales-focused goals.
 BrandBastion platform: social reporting for posts
Beyond these standard categories, consider tracking metrics that go deeper into audience sentiment and intent:
-
Comment sentiment: Understand whether the conversation around your content is positive, negative, or neutral.
- Types of comments: Track categories like purchase intent, customer complaints, product questions, or fan praise to surface insights that raw numbers alone can't reveal.
 BrandBastion platform: sentiment analysis overview
How your target audience can impact the content focus and metrics to show
| Target Audience | Content Focus | Key Performance Indicators (KPIs) |
|---|---|---|
| Your Manager / CMO |
|
|
| Your Marketing Team |
|
|
| Your client |
|
|
| Your colleagues (wider company) |
|
|
4. Gather data sources & visualize it
Collect data from the social media platforms you're active on, assembling the components that make up your overall performance picture. Before pulling numbers, choose the appropriate timeframe for your report. This could be daily, weekly, monthly, or quarterly, depending on your reporting cadence and goals.
Once you have the data, visual elements are what make it digestible. Consider using:
-
Charts and graphs to show trends over time (e.g., follower growth or engagement rate week over week).
-
Screenshots of top-performing posts to give context to the numbers and highlight what resonated with your audience.
-
Side-by-side comparisons to illustrate how different platforms, campaigns, or time periods stack up against each other.
The goal is to make your data easy to scan so your audience can quickly grasp the key takeaways.
5. Analyze and Interpret
Examine the gathered data to uncover patterns, trends, and insights. This is where reporting shifts from number-collecting to storytelling. Your goal is to translate raw information into a clear narrative that explains what happened, why it matters, and what to do next.
To make your analysis actionable, focus on these areas:
-
Identify what worked: Which posts, campaigns, or platforms drove the strongest results? Look for common traits among top performers.
-
Surface what didn't: Where did engagement fall short or sentiment dip? Understanding underperformance is just as valuable as celebrating wins.
-
Outline next steps: Summarize your key takeaways and provide clear recommendations for future strategy based on what the data reveals.
|
💡 Bonus Tip: Include a Comparative Analysis To gauge the success of your efforts, include a section that compares your current performance with previous periods. This allows you to identify growth trends, spot recurring patterns, and pinpoint areas that need attention. |
6. Craft your presentation
Create a well-structured and visually appealing social media analysis report that effectively communicates your findings. The format you choose should depend on your audience and how they prefer to consume information:
-
Spreadsheets work well for detailed, data-heavy reports where stakeholders want to dig into the numbers.
-
Slide decks are ideal for executive summaries or cross-team presentations where you need to highlight key takeaways quickly.
-
Dashboards offer a real-time view of performance and are useful for ongoing monitoring between formal reports.
Using a consistent report template helps you stay organized and ensures you don't overlook key insights, no matter how many platforms you're managing. It also saves time on formatting so you can focus on the analysis that matters most.
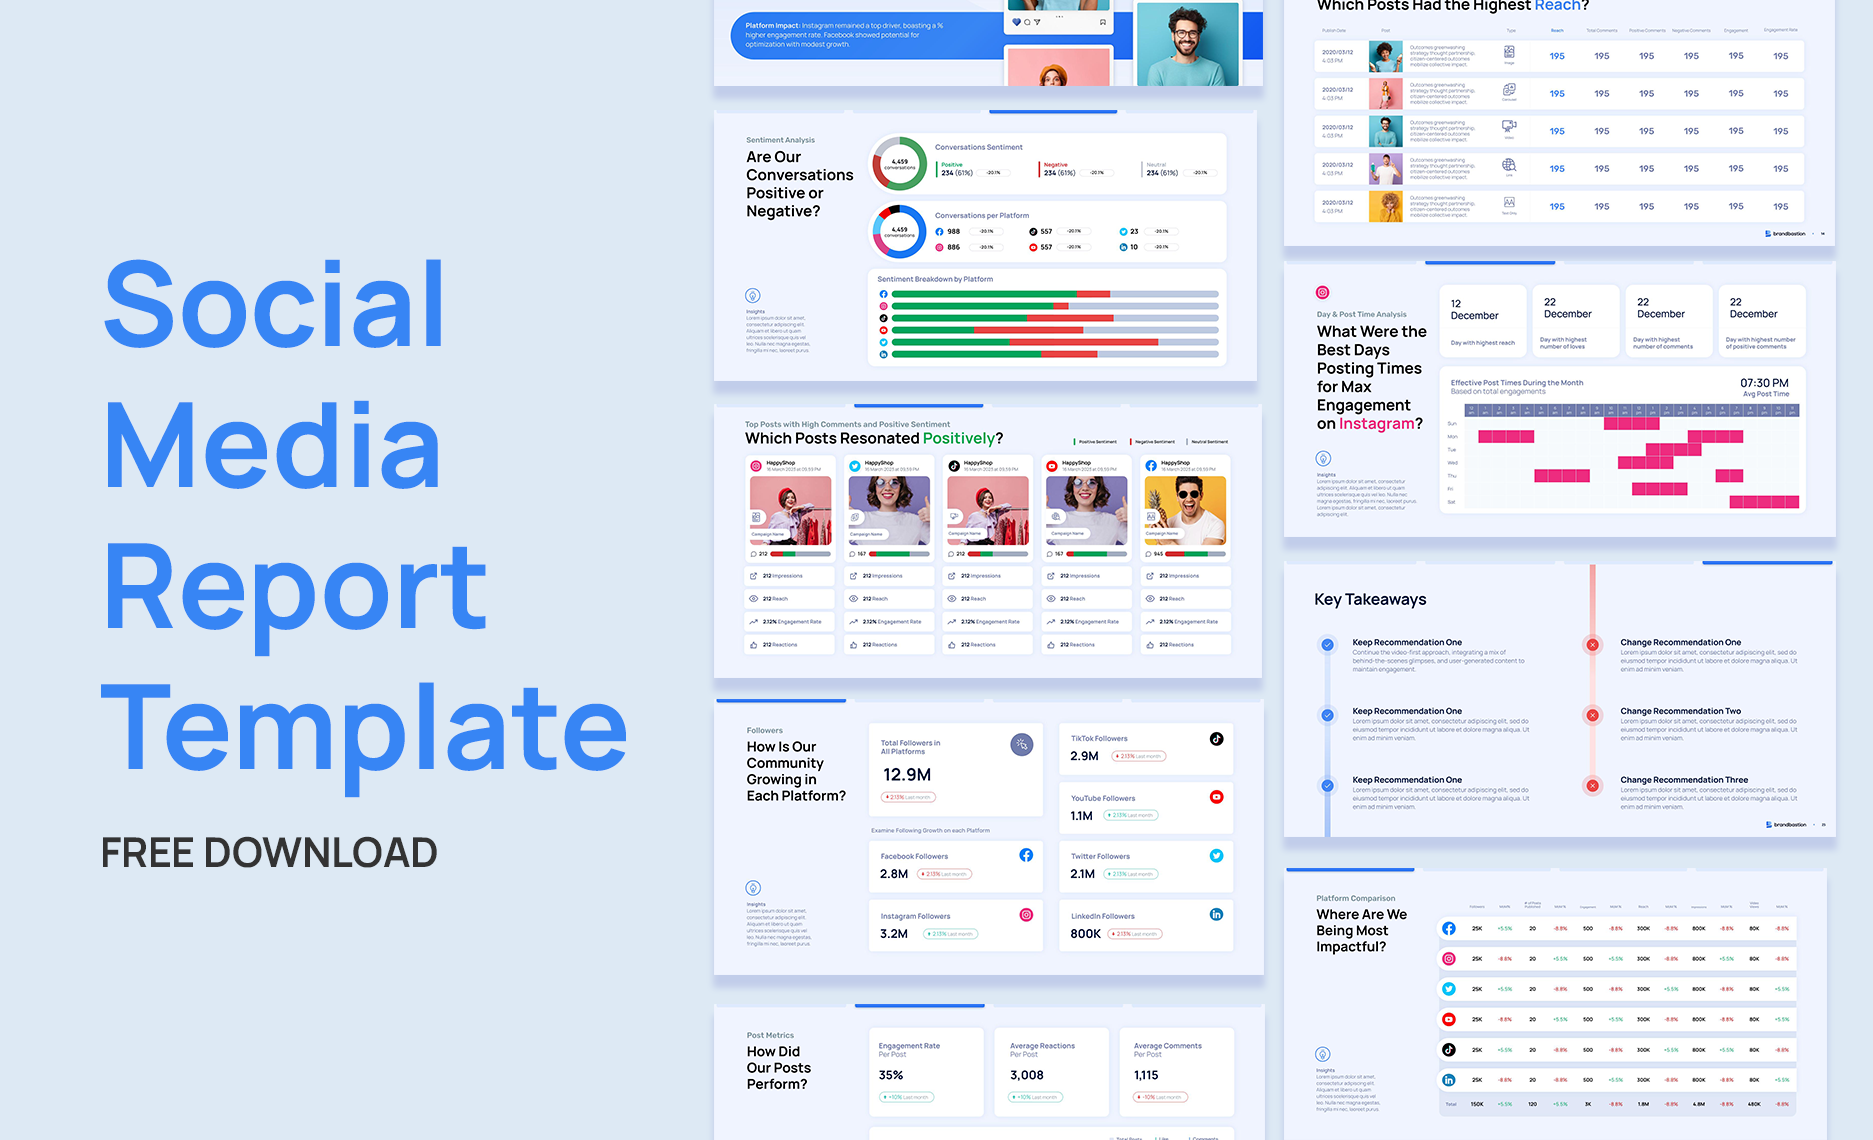
Downloadable Social Media Analytics Report slide deck template
To make the social media reporting process even easier, we are offering a free social media monthly report. This template serves as an invaluable tool for crafting comprehensive social media marketing reports that showcase your performance.
Want to build better social media reports with an analytics platform?
Social media reporting becomes much more powerful when you can go beyond surface-level metrics and understand what your audience is actually saying. With the BrandBastion platform, teams can analyze social media conversations at scale, uncover audience sentiment, and turn thousands of comments into clear, actionable insights.
BrandBastion helps you identify patterns across your content. You can track sentiment, spot recurring themes, categorize comment types, and understand which posts are driving positive reactions, product questions, complaints, or purchase intent.
With the right analytics platform, your team can access the data, explore the insights, and build better reports without waiting for manual analysis. It gives social, marketing, and CX teams a clearer view of audience feedback, brand perception, and campaign performance.